
One of the first things I do before every operating session is check propagation. What are the solar indices? Which bands are open? Are there any DX stations spotted that I want to work? Before this project, that meant opening six or seven browser tabs manually every time I sat down at the radio. Now I press one button on the Stream Deck and everything is already up and refreshing by the time the radio is warmed up.
This post covers the second major piece of the Stream Deck project — a locally-hosted propagation and operating portal that I call the N4MI Dashboard. It’s tailored specifically to my callsign, my grid square (EM83), and the way I operate.
There’s no shortage of ham radio dashboard options out there. Dedicated display apps like GeoChron Atlas Pro and HamClock are excellent — I actually run both of those on dedicated screens at my operating position. There are also several web-based dashboards with maps, propagation data, and cluster feeds. I could have used any of these as my operating portal, but what I was really looking for was a balance — enough information to make good operating decisions without the screen becoming overwhelming. Building my own meant I could include exactly what I use, organized exactly the way I want it, with my callsign and grid square baked in from the start.
Why a Local Web Server?
The dashboard is an HTML file, but it can’t just be opened as a file directly from the hard drive. Browsers block cross-origin data requests from local files — a security feature called CORS. To fetch live data from external APIs like NOAA and HamQSL, the page needs to be served from a local web server instead.
The solution is a one-line Python web server. Python is already installed on most ham radio PCs, and starting the server takes a single command. A dedicated Stream Deck button runs a PowerShell script that checks whether the server is already running, starts it if it isn’t, and then opens the dashboard in Chrome — all with one press. If the server is already running from a previous session, it skips straight to opening Chrome.
What the Dashboard Shows
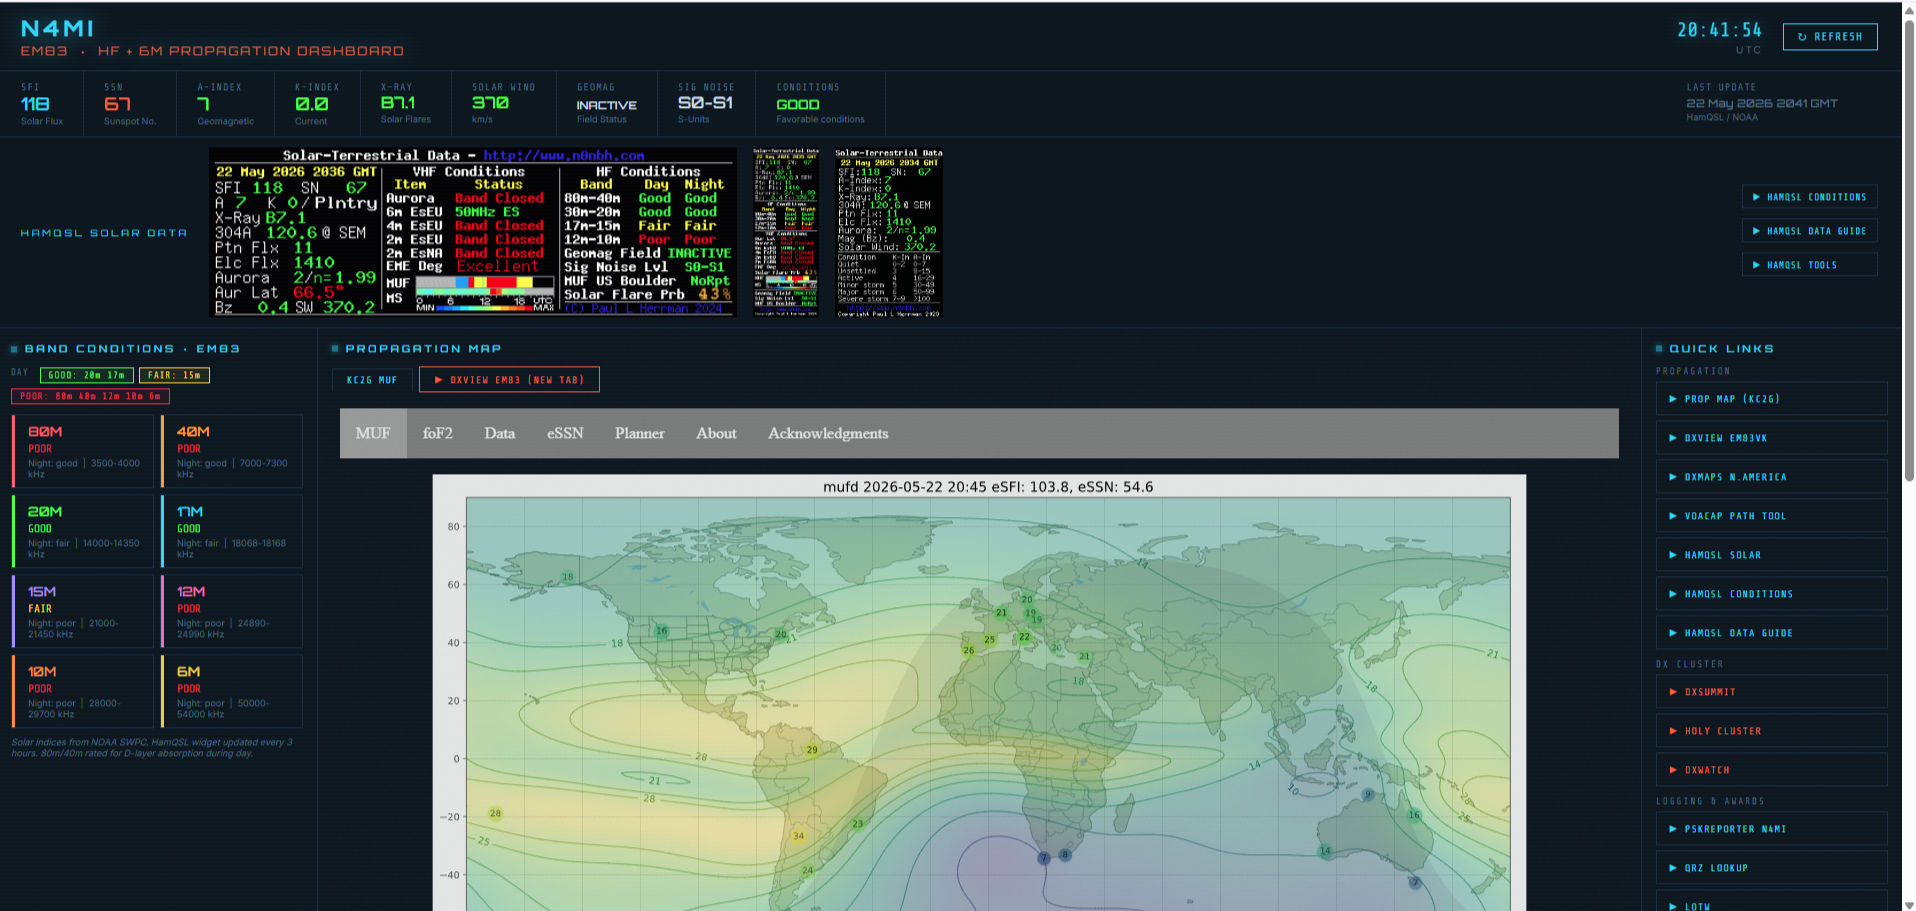
The dashboard is organized into several sections, each pulling live data from a different source.
Solar Indices Bar
Across the very top is a live readout of current solar conditions pulled from NOAA and HamQSL: Solar Flux Index (SFI), Sunspot Number (SSN), A-Index, K-Index, X-Ray class, Solar Wind speed, Geomagnetic field status, and an overall conditions summary. The K-Index is color coded — green for quiet, yellow for unsettled, red for active — so I can see at a glance whether geomagnetic conditions are going to affect a DX session.
HamQSL Widget Bar
Three embedded HamQSL visual widgets display HF band conditions, VHF/Aurora/Es status, and a solar data summary — updated every three hours directly from hamqsl.com.
Band Conditions Panel
This panel shows current conditions for 80m through 6m, rated Good / Fair / Poor for both day and night. One detail I was careful about here: the model accounts for D-layer absorption on 80m and 40m during daylight hours. A lot of simpler tools don’t get this right — 80m is not good in the middle of the day regardless of what the solar flux says, and the dashboard reflects that correctly. Each band also shows the expected frequency range for good propagation and what conditions will look like in the opposite period.
Propagation Map
The KC2G real-time MUF map is embedded directly in the dashboard and updates automatically. A one-click button also opens the DXView EM83VK link in a new tab — this shows actual real-time propagation based on WSPRnet, Reverse Beacon Network, and DX Cluster signals, updated every minute. Between the two, I have a very complete picture of what’s actually happening on the bands right now.
DX Cluster Spots
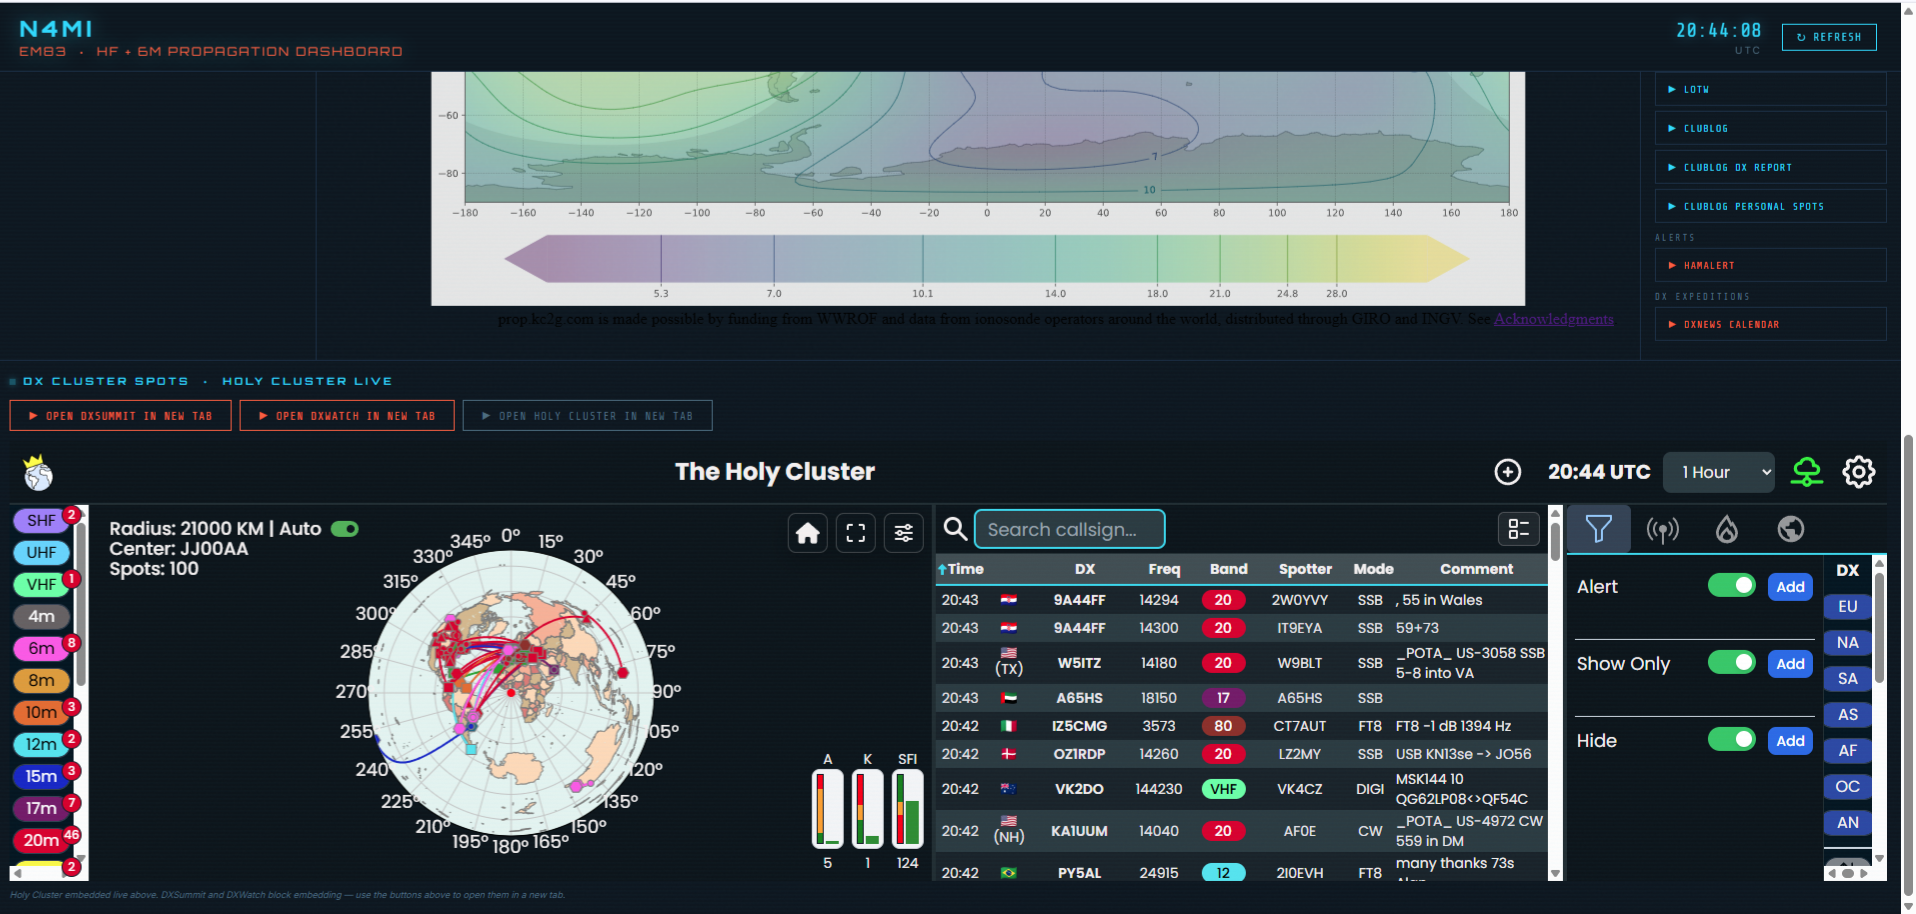
The Holy Cluster is embedded as a live iframe directly in the dashboard, with the full interactive map and spot list visible without leaving the page. DXSummit and DXWatch are available as one-click buttons that open in a new tab — those sites block iframe embedding due to browser security restrictions, which is a limitation of how they’re configured rather than a flaw in the dashboard.
Quick Links Panel
The right side of the dashboard has an organized set of one-click links grouped by category: Propagation, DX Cluster, Logging and Awards, DX Expeditions, and Alerts. PSKReporter is filtered directly to N4MI spots. Everything I need is one click away without hunting through bookmarks.
Storm Alert System
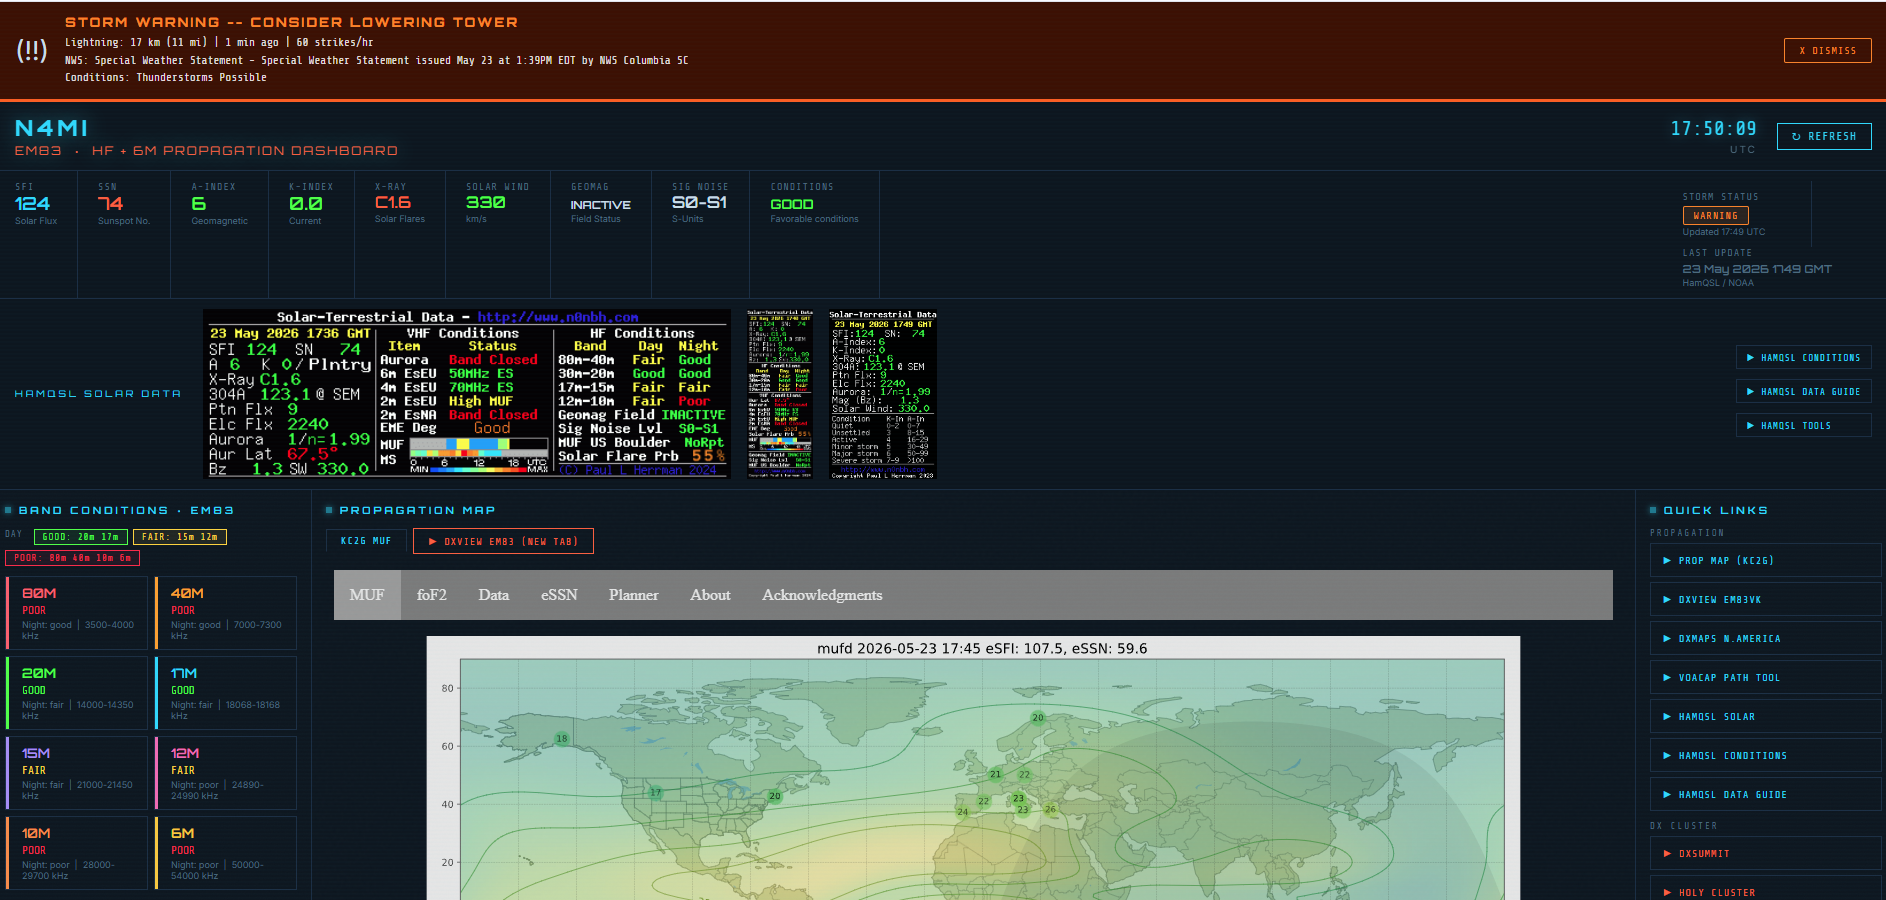
This feature came out of a real-world wake-up call. A popup thunderstorm with high winds and lightning arrived faster than expected one afternoon, and I realized I needed a proactive warning system built into my operating workflow — not a separate weather app I might not have open. The result is an integrated storm alert system that monitors two data sources simultaneously: my WeatherFlow Tempest personal weather station for hyperlocal lightning detection and wind data, and the NOAA National Weather Service alerts API for official watches and warnings affecting Columbia County.
The system uses three alert levels — Caution (yellow), Warning (orange), and Critical (red, flashing) — based on lightning distance, wind speed, and NWS alert type. When an alert is active, a full-width banner appears at the very top of the dashboard regardless of scroll position, showing lightning distance in miles, time since the last strike, strikes per hour, wind gust speed, and the full NWS alert text. The Critical level triggers on a Tornado Warning or Severe Thunderstorm Warning and displays a hard-to-ignore message: SEVERE STORM WARNING — LOWER TOWER NOW!
Even when conditions are clear, a persistent Storm Status indicator in the solar indices bar shows ALL CLEAR in green so I always know the system is active and current. During testing, the system correctly triggered a WARNING when the Tempest detected lightning 9 miles away with 356 strikes per hour — well before I would have noticed anything outside. For anyone running a tower, this kind of real-time situational awareness is worth having right in your operating portal.
How It’s Built
The dashboard runs on two files stored in C:\Ham Scripts\:
dashboard_server.py— a Python web server that serves the HTML file and acts as a proxy for fetching HamQSL XML data and DX cluster spots via telnet, bypassing browser CORS restrictionsN4MI_PropagationDashboard.html— the dashboard itself, which fetches live data from NOAA and through the local Python proxy on startup and on each manual refresh
The Python server connects to US-based telnet DX cluster nodes to fetch the latest spots, parses them by band, and serves them to the dashboard as JSON. It tries three nodes in order and falls back gracefully if one is unavailable.
Claude generated both files based on my description of what I wanted the dashboard to display. The iterative process of describing a feature, seeing the result, and refining it worked very well for something this visual — I could describe exactly what I wanted each section to look like and Claude would implement it.
Adapting It for Your Station
To use this dashboard for your own station, two things need to change:
- Update
CALLSIGN = "N4MI"indashboard_server.pyto your own callsign - Update the callsign and grid square references in
N4MI_PropagationDashboard.html— the DXView link and band conditions model both use the EM83 grid square, so those should be updated to your own grid for accurate local propagation ratings
Adapting This Project
This project was built specifically for my station, equipment, and workflows.
If you decide to try it yourself, you will likely need to adjust file locations, hardware settings, network addresses, APIs, or other configuration details to match your own environment.
Rather than viewing the project as a finished product, think of it as an example of what can be created and adapted for your own shack.
Modern AI tools can often help make those changes quickly, even if you have little or no programming experience.
Both files are available for download in the project’s GitHub repository: github.com/N4MI73/streamdeck-hamradio
The next post in this series covers rotator control directly from the Stream Deck — sending azimuth commands to PSTRotatorAz via UDP with one button press, including preset headings for common DX regions from EM83.