Stream Deck for Ham Radio — Part 5: Custom Icons, Getting Started & Closing Thoughts

This is the final post in the Stream Deck for Ham Radio series. We’ve covered mode launchers, a live propagation dashboard with storm alerts, rotator control, and a ham radio content aggregator. This post ties it all together — how the custom icons were created, how to get started building your own setup from scratch, and some closing thoughts on how this project evolved.

Everything built in this series is available for download at the project’s GitHub repository: github.com/N4MI73/streamdeck-hamradio. A complete step-by-step setup guide is also available as a PDF download — more on that at the end of this post.

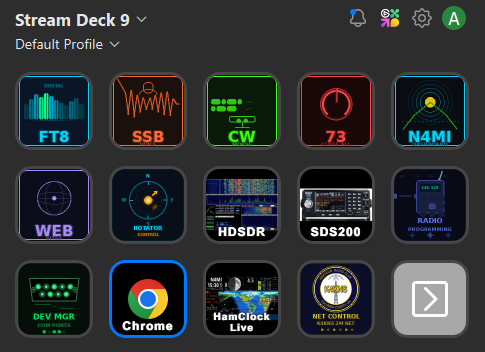
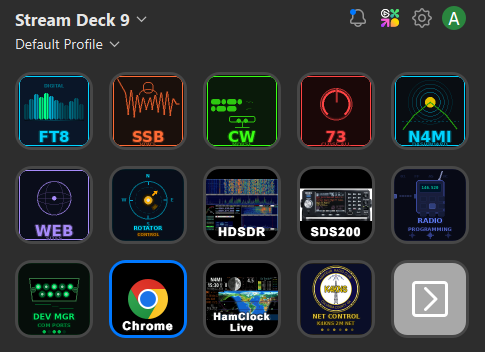
Stream Deck main button layout for ham radio showing FT8, SSB, CW, rotator control, dashboard, and utility buttons
The main Stream Deck layout as it stands today — mode launchers across the top row, utility and control buttons below, with folder buttons opening dedicated pages for rotator control and radio programming.

Custom Icons

The Stream Deck’s physical buttons are small — about 15mm square — so icons need to communicate their function at a glance without any reading required. The built-in Stream Deck software includes a basic icon editor and access to a marketplace, but I wanted something more cohesive — a consistent visual language across every button that made the whole layout feel like a purpose-built tool rather than a collection of random images.

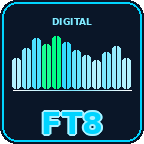
All of the custom icons in this project were generated using Python with the Pillow imaging library, with Claude helping design and write the generation scripts. Each icon is a 144×144 PNG with a dark background, rounded corners to match the physical button shape, and color coding by function — cyan for digital modes and web tools, warm tones for voice modes, red for shutdown, and compass-themed designs for the rotator controls.

Here’s a sample of the icon set:

The radio programming folder contains icons for each radio in the shack — actual photos of each model used as button images, making it immediately obvious which button opens which programming software. This folder was added after the rest of the project was built, which is a good example of how the setup grows naturally over time.

Stream Deck radio programming folder showing RT Systems and other programming software buttons
The radio programming folder — each button opens the programming software for a specific radio. The RT Systems subfolder was added later as the shack’s radio collection grew.
Stream Deck RT Systems subfolder showing radio icons for each programmable radio
The RT Systems subfolder — a nested folder within radio programming, added organically as the project evolved. Each button shows the actual radio model for instant recognition.

The complete icon set — all 39 icons including compass directions, DX region presets, mode launchers, utility buttons, and radio programming icons — is available in the icons/ folder of the GitHub repository.

Getting Started

If this series has you interested in building your own setup, here’s the honest starting point: you don’t need to build everything at once. The most useful place to start is a single button that launches one app you open every operating session. Get that working, then add another. The full setup shown in this series grew one button at a time over several weeks.

The minimum requirements to get started:

  • An Elgato Stream Deck (any model — the 15-key MK.2 is a good starting point)
  • The free Stream Deck software from Elgato
  • The free Advanced Launcher plugin by BarRaider from the Stream Deck Plugin Store
  • Python 3.x installed with “Add to PATH” checked — only needed for the dashboard
  • The scripts and files from the GitHub repository saved to C:\Ham Scripts\

The scripts are plain text files that can be opened and edited in Notepad. The paths to your applications are set at the top of each script — update those to match your installation and everything else works as written. Claude at claude.ai can write or troubleshoot PowerShell scripts if you describe what you want — that’s exactly how all of the scripts in this project were built.

A complete step-by-step guide covering everything from finding app paths to configuring Stream Deck buttons, writing PowerShell scripts, setting up the dashboard server, and creating custom icons is available as a free PDF download:

📄 Download the Stream Deck Setup Guide (PDF)

Closing Thoughts

This project started with a simple goal — stop manually opening the same five apps every time I sat down to operate. It grew from there into something I use every day: mode launchers, a propagation portal, storm alerts, rotator control, a content aggregator, and a full set of custom icons. None of it was planned from the start. Each piece was added because something in the workflow felt like it could be smoother.

That’s the thing about a setup like this — it’s never really finished, and it doesn’t need to be. The Stream Deck is just a tool for running scripts, and PowerShell scripts are just text files. Adding a new button takes a few minutes. Changing how something works takes editing a few lines in Notepad. The barrier to customization is low enough that the setup can evolve naturally with your operating habits.

I’m sharing all of this as a fellow hobbyist — not for any commercial purpose, and not because my particular setup is the right one for anyone else’s shack. The scripts, dashboard, icons, and setup guide are all free to download, modify, and build upon. If you improve something, add a feature that would be useful to others, or adapt this for a different logging program or rotator controller, please share it. That’s how the ham radio community has always worked, and it’s how this kind of project gets better over time.

Thanks for following along with the series. The complete project is at github.com/N4MI73/streamdeck-hamradio. 73 de N4MI!

Stream Deck for Ham Radio — Part 4: HamShackFeed — My Personal Ham Radio Newsroom

Ham radio has a surprisingly rich content ecosystem. There are blogs covering DX expeditions and technical topics, podcasts perfect for the commute, and YouTube channels with tutorials, reviews, and operating demonstrations. The problem isn’t that the content isn’t out there — it’s that it’s scattered across a dozen different sites, and keeping up with all of it means either spending half your operating time clicking through bookmarks or missing things entirely.

I’ve had the experience of finding out about a DX expedition after it was already over, or discovering a podcast episode that would have been useful before a contest two weeks after it aired. A folder of bookmarks you mean to check regularly is not the same as actually checking them regularly. What I wanted was one place where everything shows up automatically — blogs, podcasts, and videos — without any clicking around.

The result is HamShackFeed — a single HTML file that aggregates RSS feeds from ham radio blogs, podcasts, and YouTube channels into one clean, searchable dashboard. No installation. No server. No account. No subscription fee. Just open the file in Chrome and your content is there.

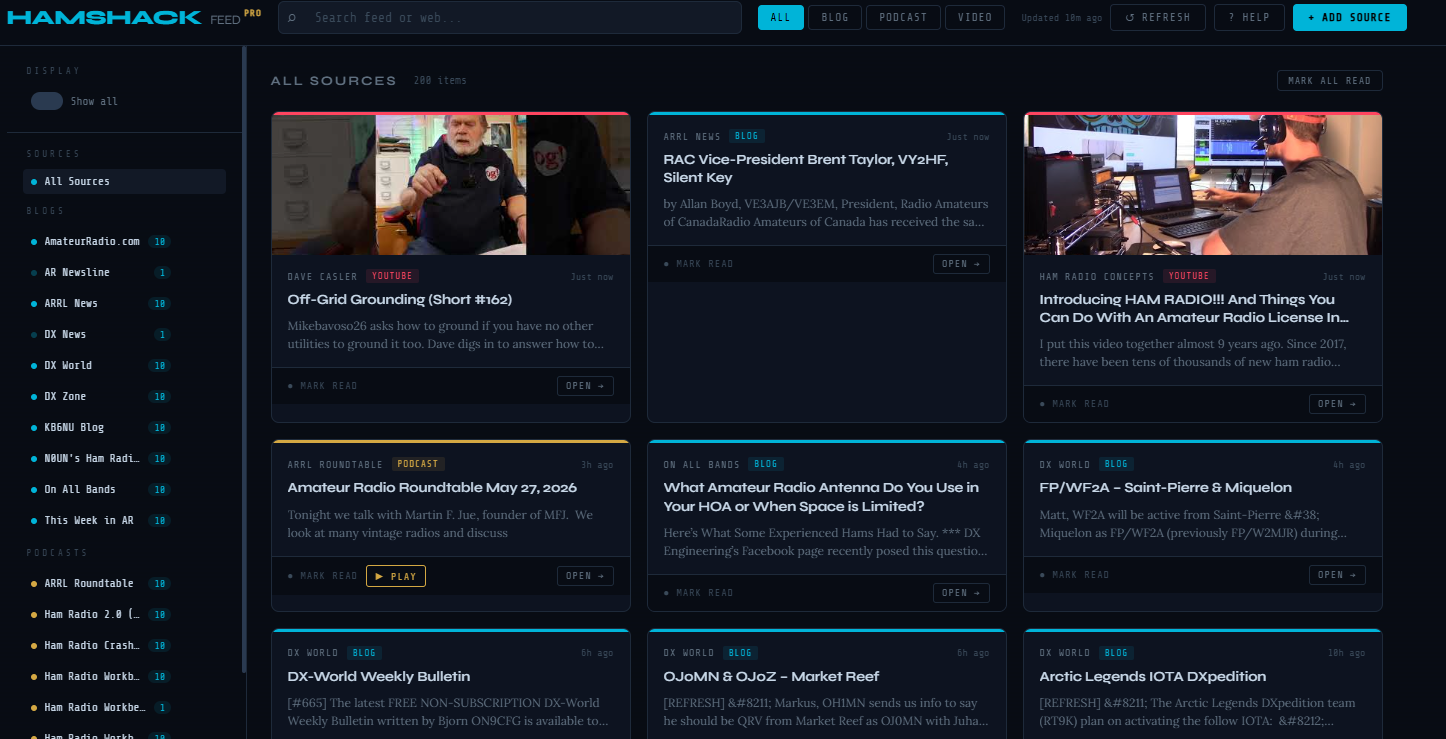
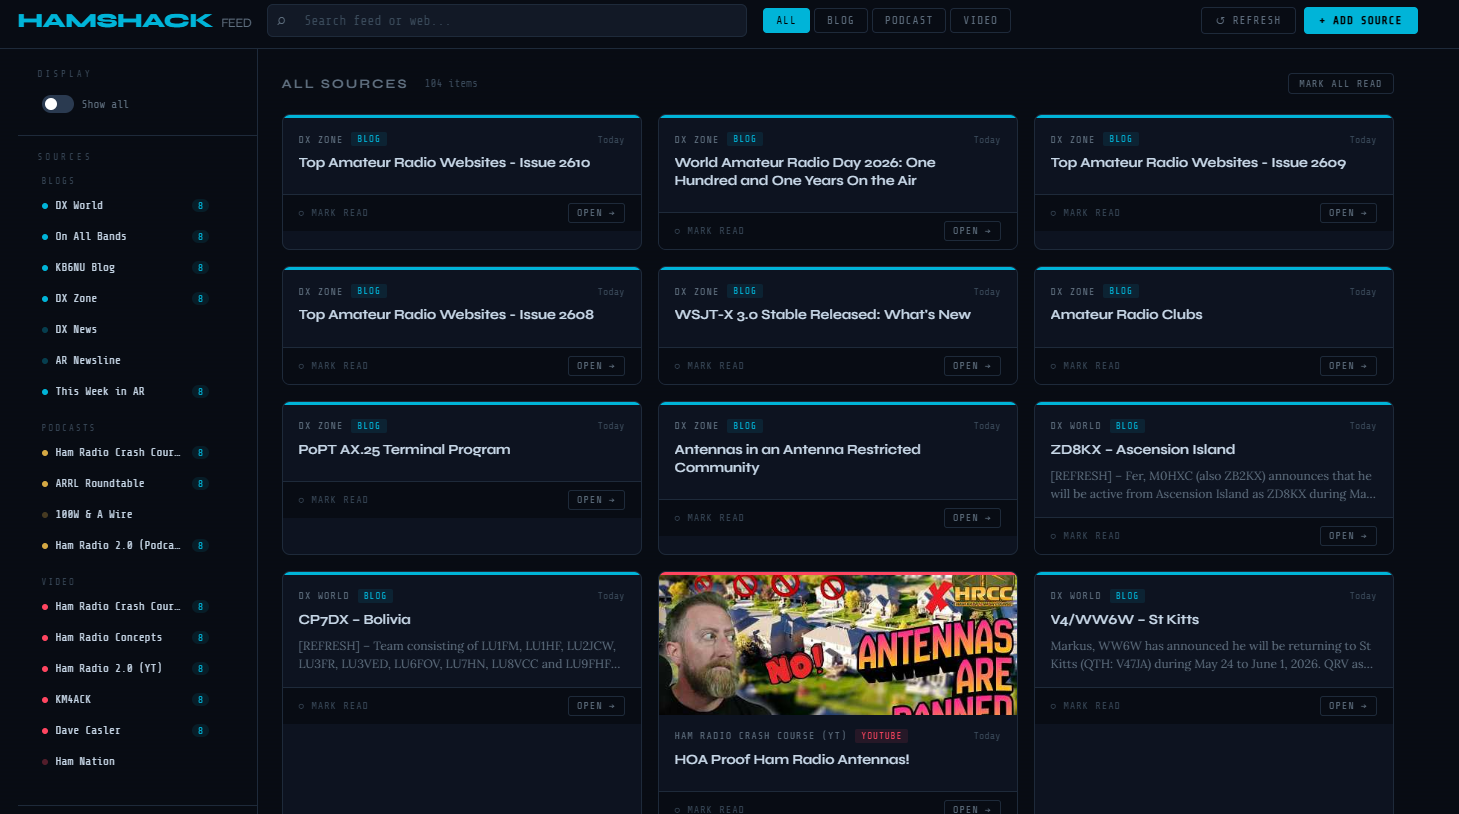
HamShackFeed dashboard showing ham radio blog, podcast, and YouTube content cards in a three-column layout with source sidebar and filter buttons
HamShackFeed loaded with 104 items across 17 sources — blogs, podcasts, and YouTube channels all in one view. The ZD8KX Ascension Island DX expedition announcement and a new WSJT-X 3.0 release notice are visible alongside YouTube thumbnails from Ham Radio Crash Course.

What Is RSS?

RSS (Really Simple Syndication) has been around since the early days of the internet and remains the most reliable, algorithm-free way to follow content. Almost every blog, podcast, and YouTube channel publishes an RSS feed — a structured list of their latest content that any reader can consume. There’s no feed curation, no promoted posts, no engagement-based sorting. Just the actual content from the sources you choose, in chronological order. Most people don’t know it’s there, but it’s been quietly powering podcast apps and news readers for decades.

The Sources

HamShackFeed comes pre-configured with 17 sources across three content types, all color coded — cyan for blogs, gold for podcasts, red for YouTube.

Blogs — DX World, On All Bands, KB6NU’s Ham Radio Blog, DX Zone, DX News, AR Newsline, and This Week in Amateur Radio. Between them these cover DX expedition announcements, operating tips, propagation news, technical articles, and the weekly ham radio news cycle.

Podcasts — Ham Radio Crash Course (Josh KD9FRQ), ARRL Roundtable, 100 Watts and a Wire, and Ham Radio 2.0 (Jason KC5HWB). All fetched directly via RSS — no podcast app required.

YouTube — Ham Radio Crash Course, Ham Radio Concepts, Ham Radio 2.0, KM4ACK, Dave Casler (KE0OG), and Ham Nation. YouTube publishes an RSS feed for every channel, so new video titles, descriptions, and thumbnails appear in the dashboard automatically — no YouTube API key needed.

Features

Each piece of content appears as a card showing the source, content type, publication date in human-readable form (Today, Yesterday, 3d ago), title, description excerpt, and thumbnail when available. Four filter buttons at the top — All, Blog, Podcast, Video — narrow the view instantly. The source sidebar on the left lists all sources grouped by type, each with an unread count badge, and clicking any source filters the feed to show only that source’s content.

Read tracking is built in — each card has a Mark Read button, and once marked, cards dim but stay visible. An Unread Only toggle hides everything already read so you can focus on fresh content. Mark All Read clears the queue in one click. All read state is stored in your browser’s local storage and persists between sessions.

The search bar at the top filters feed items in real time as you type. Longer queries also trigger a DuckDuckGo web search filtered to ham radio content, with results appearing below the main feed — a quick way to find content beyond what’s in your current source list.

Adding a new source is straightforward — paste any blog URL, podcast URL, or YouTube channel URL into the Add Source modal and the dashboard detects the feed automatically. Paste a YouTube channel URL and it extracts the channel ID and constructs the RSS feed URL without any manual steps. Added sources persist in local storage and survive page refreshes.

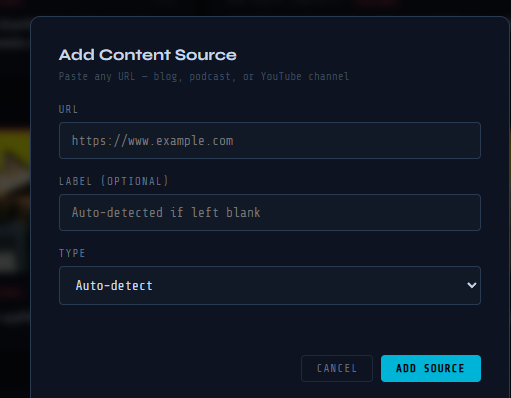
HamShackFeed Add Content Source modal showing URL field, optional label field, and auto-detect type dropdown
The Add Content Source modal — paste any blog, podcast, or YouTube channel URL and the dashboard auto-detects the feed type and label. No manual RSS URL hunting required.
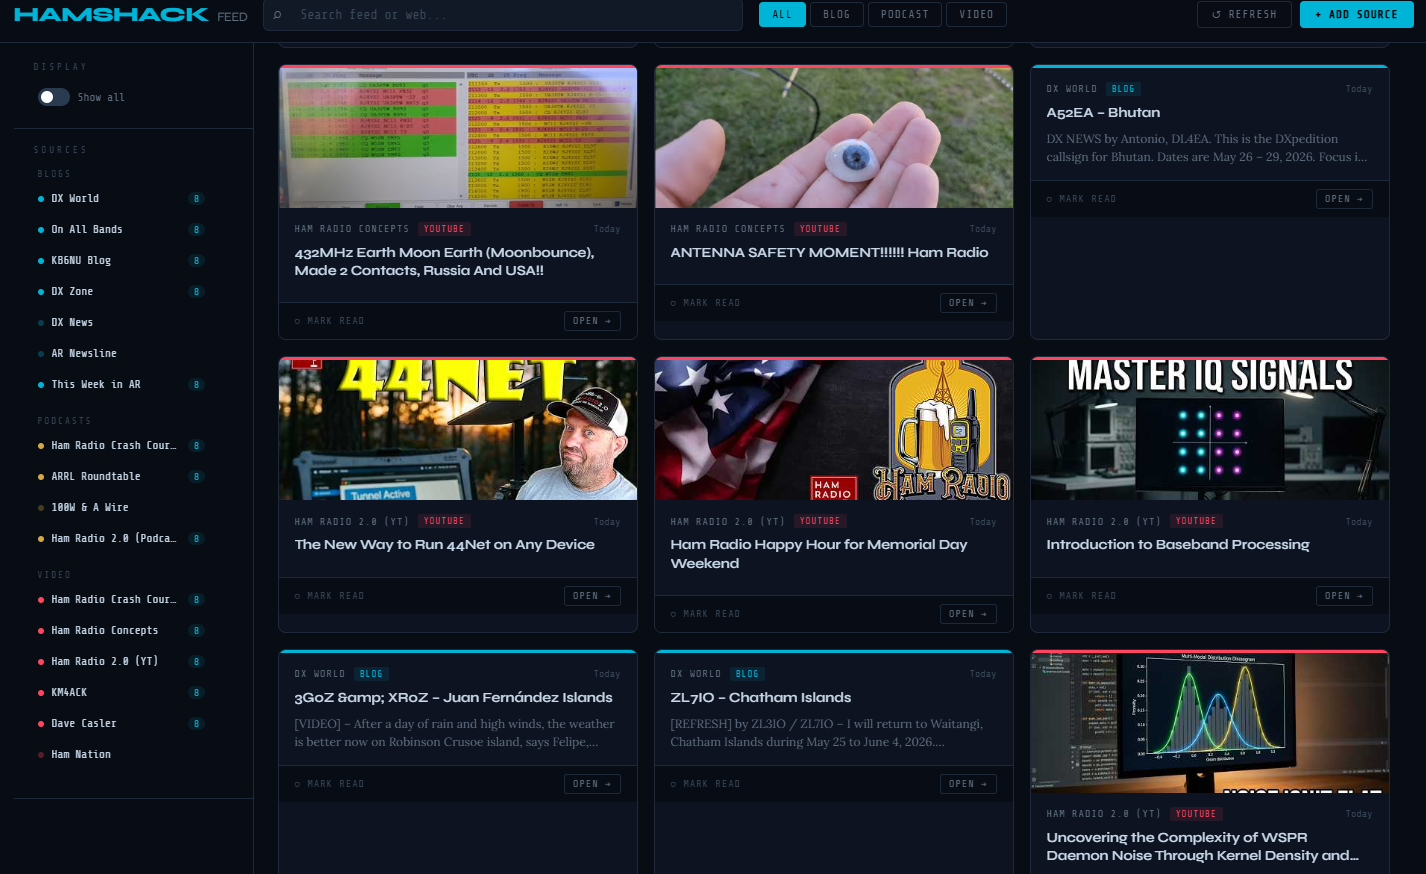
HamShackFeed showing YouTube video thumbnail cards from Ham Radio Concepts and Ham Radio 2.0 alongside DX World blog cards for active DX expeditions
YouTube cards display full thumbnails alongside blog content — three active DX expeditions (A52EA Bhutan, 3G0Z Juan Fernández Islands, ZL7IO Chatham Islands) visible alongside EME and digital mode video content from Ham Radio Concepts and Ham Radio 2.0.

How It Works

HamShackFeed is a completely self-contained HTML file. Unlike the propagation dashboard from Part 2 of this series, it doesn’t need a local Python server — it works by opening the file directly in Chrome. Feed fetching uses the free rss2json.com API, which handles the browser’s cross-origin restrictions (CORS) by fetching feeds server-side and returning them as clean JSON. All state — read items, added sources, removed sources — is stored in browser localStorage. Nothing is sent to any server except the feed fetch requests themselves.

Getting Started

Requirements: Google Chrome (or any modern browser) and an internet connection. That’s it — no Python, no PowerShell, no installation of any kind.

  • Download HamShackFeed.html from the project’s GitHub repository: github.com/N4MI73/streamdeck-hamradio
  • Save it anywhere on your PC — C:\Ham Scripts\ works well if you have the Stream Deck setup from the rest of this series
  • Open it in Chrome — double-click it in File Explorer or drag it into a Chrome window
  • Feeds load automatically — give it 10–20 seconds for all sources to fetch
  • Click Unread Only to focus on fresh content, use the filter buttons to narrow by type, and add or remove sources to match your interests

Bookmark the local file path in Chrome for easy access: file:///C:/Ham%20Scripts/HamShackFeed.html

Adding It to Your Stream Deck

If you’re following this series and already have a Stream Deck set up, adding HamShackFeed takes about 30 seconds. Use the Advanced Launcher plugin with Chrome as the application and the file path as the argument:

--profile-directory="Profile 1" "C:\Ham Scripts\HamShackFeed.html"

A matching Stream Deck icon is available in the icons folder of the GitHub repository.

Sharing With Other Hams

Because HamShackFeed is a single self-contained file with no dependencies, sharing it is as simple as sharing any file — email it, put it on a club website, or link it from GitHub. Anyone can download and use it immediately. The default source list is pre-configured with all 17 sources, and each operator’s customizations (added sources, read state) are stored locally in their own browser — sharing the file with another ham gives them a clean slate with the default sources, not your personal configuration.

There’s also an interesting club application here. A club could maintain a version pre-configured with their own newsletter RSS feed, local repeater club news, and regional content alongside the general ham radio sources — then share it at a club meeting as a single-file download.

Closing Thoughts

The ham radio content community is larger and more active than many operators realize. HamShackFeed makes it practical to follow all of it without spending time hunting for updates. RSS is older than most social media platforms but remains the best way to follow content on your own terms — no algorithm deciding what you see, no promoted posts, just the content from the sources you choose in the order it was published.

This is version 1. Future ideas on the list include audio playback for podcasts directly in the dashboard, DXCC expedition alert integration to cross-reference DX World announcements with your most wanted list, and a mobile-friendly layout for tablet use at the operating position.

Download HamShackFeed from the project repository at github.com/N4MI73/streamdeck-hamradio.

Stream Deck for Ham Radio — Part 3: Rotator Control

One of the more satisfying parts of this whole project was getting rotator control working directly from the Stream Deck. Before this, pointing the beam meant switching to PSTRotatorAz, clicking a bearing, and waiting. Now I press one button and the rotator starts moving. For DX region presets, I press the Europe button and the beam swings to 50 degrees automatically — no manual entry required.

This post covers Part 3 of the Stream Deck series — controlling a Yaesu antenna rotator directly from the Stream Deck using PowerShell scripts that send UDP commands to PSTRotatorAz.

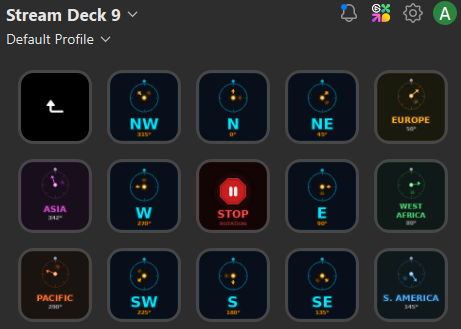
Stream Deck rotator control page showing compass direction buttons, DX region presets, stop button, and bearing query button
The rotator control page — compass directions across the top two rows, DX region presets along the bottom, with Stop and Bearing query buttons in the center.

How It Works

PSTRotatorAz supports remote control via UDP on port 12000. A PowerShell script can send an azimuth command directly to the running software using a simple XML-formatted UDP packet — no third-party plugin required, just PowerShell’s built-in networking. The command format is straightforward:

<PST><AZIMUTH>270</AZIMUTH></PST>

That’s it. PSTRotatorAz receives the packet and starts rotating to the specified bearing. The script validates the azimuth value (0–360), sends the command, confirms it in the console, and exits. The whole thing runs in under a second.

Enabling UDP Control in PSTRotatorAz

Before the scripts will work, UDP control needs to be enabled in PSTRotatorAz:

  • Open PSTRotatorAz
  • Go to Communication → UDP Control → Enable
  • Set the port to 12000 (default)
  • Click OK and confirm the UDP indicator is active

To verify the port is available before enabling: open a PowerShell window and run netstat -ano | findstr ":12000" — no output means the port is free.

The Two Scripts

RotatorAzimuth.ps1 is the workhorse. It accepts a single -az argument and sends the corresponding azimuth command to PSTRotatorAz. Every compass direction button and every DX region preset calls the same script with a different azimuth value:

-ExecutionPolicy Bypass -File "C:\Ham Scripts\RotatorAzimuth.ps1" -az 50

RotatorStop.ps1 sends an immediate stop command to PSTRotatorAz, halting rotation wherever the antenna currently is. This is useful if you press the wrong direction button or want to stop mid-swing.

Both scripts are available for download in the project’s GitHub repository: github.com/N4MI73/streamdeck-hamradio

Button Layout

The rotator control page is organized as a folder within the main Stream Deck layout — pressing the Rotator Control button on the main page opens this dedicated page with an automatic back button in the top left corner.

The layout is arranged in three rows:

  • Row 1 — Back button, NW (315°), N (0°), NE (45°), Europe (50°)
  • Row 2 — Asia (342°), W (270°), STOP, E (90°), West Africa (80°)
  • Row 3 — Pacific (290°), SW (225°), S (180°), SE (135°), S. America (145°)

The compass directions are arranged spatially so they mirror an actual compass rose — N at the top center, S at the bottom center, and the intercardinal points in their correct positions. The DX region presets are placed on the outer edges next to the compass direction they’re closest to, making it intuitive to find the right button at a glance.

DX Region Presets

The five DX region buttons use approximate great-circle headings from my grid square EM83 in central Georgia:

  • Europe — 50°
  • West Africa — 80°
  • S. America — 145°
  • Pacific — 290°
  • Asia — 342°

These are starting points rather than exact headings — propagation paths vary by band and conditions. For a quick DX pileup, pressing Europe and being within a few degrees is close enough. For precision work, PSTRotatorAz’s built-in DXCC lookup or an online great-circle calculator will give you the exact bearing. Operators in other grid squares should calculate their own headings and update the -az values in their Stream Deck button configurations accordingly.

The Custom Icons

Each rotator button has a custom icon showing a compass rose with the beam arrow pointing in the correct direction, color coded by type — cyan/blue for compass directions, earth-tone colors for DX regions, and red for the Stop button. At a glance I can tell exactly where each button will point the beam without reading the label. The Bearing button shows a compass with a query indicator — pressing it displays the current azimuth reported by PSTRotatorAz.

The next and final post in this series covers how the custom icons were created, a getting started guide for operators who want to build their own setup from scratch, and some closing thoughts on how this project evolved over time.

Stream Deck for Ham Radio — Part 2: A Live Propagation Dashboard

One of the first things I do before every operating session is check propagation. What are the solar indices? Which bands are open? Are there any DX stations spotted that I want to work? Before this project, that meant opening six or seven browser tabs manually every time I sat down at the radio. Now I press one button on the Stream Deck and everything is already up and refreshing by the time the radio is warmed up.

This post covers the second major piece of the Stream Deck project — a locally-hosted propagation and operating portal that I call the N4MI Dashboard. It’s tailored specifically to my callsign, my grid square (EM83), and the way I operate.

There’s no shortage of ham radio dashboard options out there. Dedicated display apps like GeoChron Atlas Pro and HamClock are excellent — I actually run both of those on dedicated screens at my operating position. There are also several web-based dashboards with maps, propagation data, and cluster feeds. I could have used any of these as my operating portal, but what I was really looking for was a balance — enough information to make good operating decisions without the screen becoming overwhelming. Building my own meant I could include exactly what I use, organized exactly the way I want it, with my callsign and grid square baked in from the start.

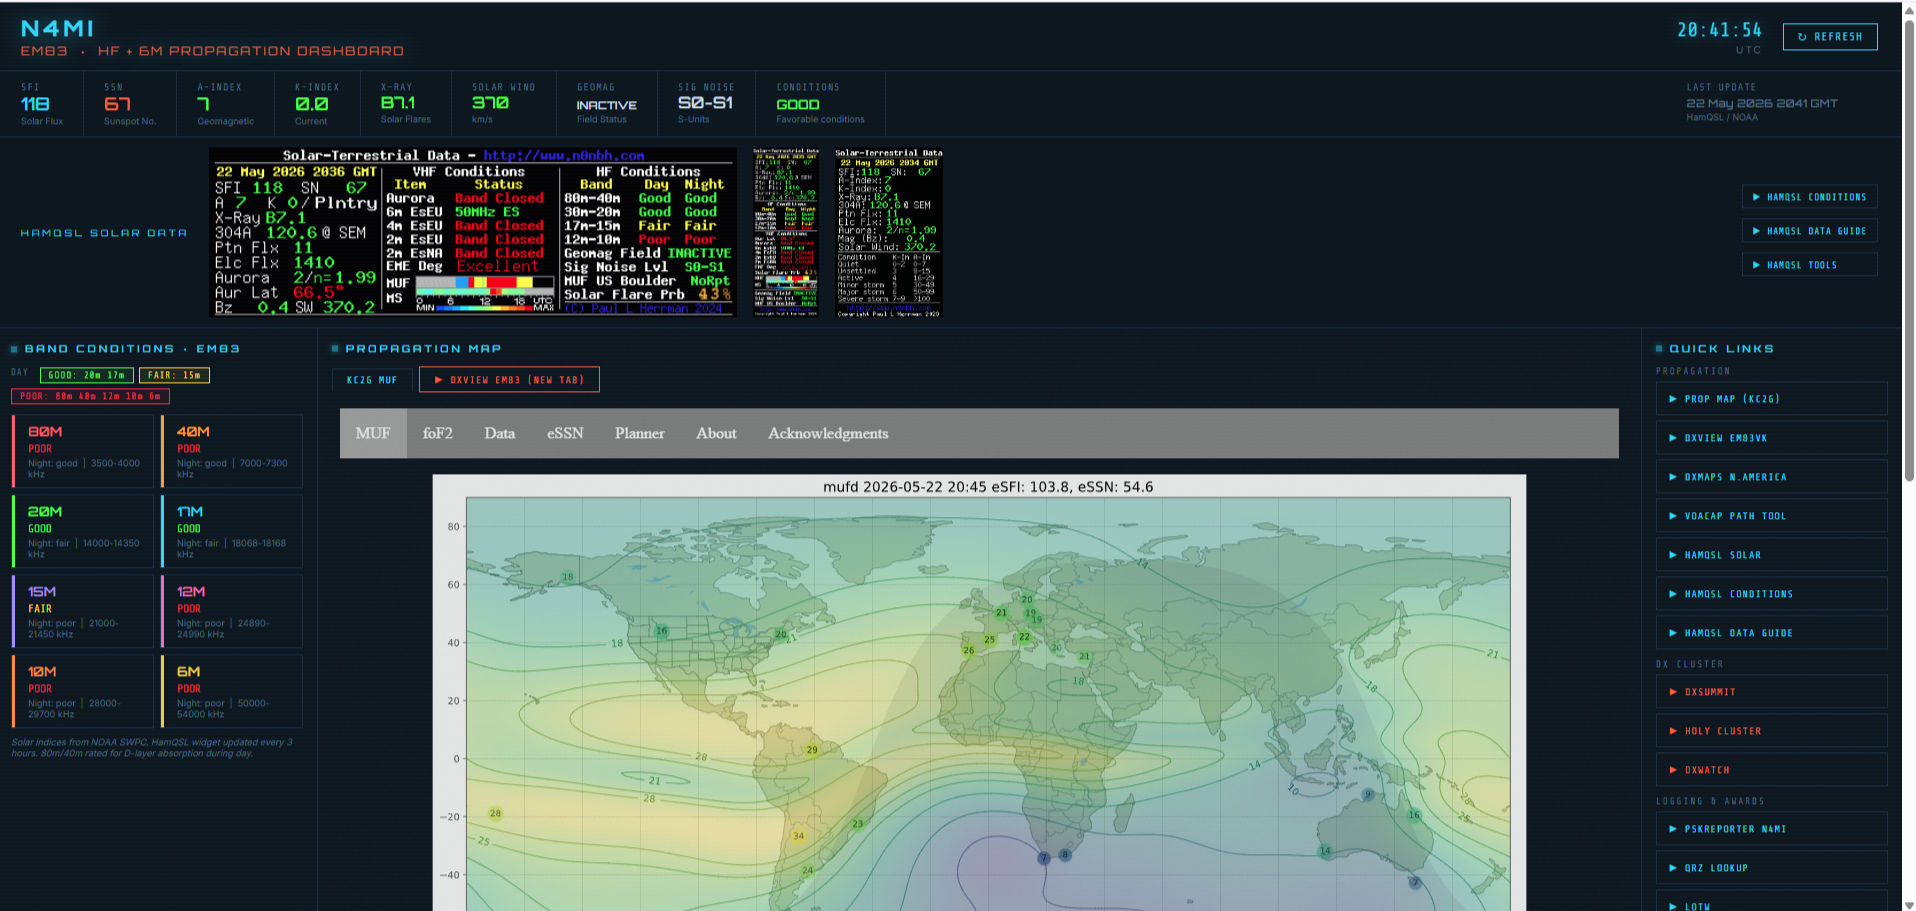
N4MI Propagation Dashboard showing solar indices, HamQSL data, band conditions panel, and KC2G MUF propagation map
The upper half of the dashboard — solar indices across the top, HamQSL widget data, band conditions for EM83, and the KC2G real-time MUF propagation map.

Why a Local Web Server?

The dashboard is an HTML file, but it can’t just be opened as a file directly from the hard drive. Browsers block cross-origin data requests from local files — a security feature called CORS. To fetch live data from external APIs like NOAA and HamQSL, the page needs to be served from a local web server instead.

The solution is a one-line Python web server. Python is already installed on most ham radio PCs, and starting the server takes a single command. A dedicated Stream Deck button runs a PowerShell script that checks whether the server is already running, starts it if it isn’t, and then opens the dashboard in Chrome — all with one press. If the server is already running from a previous session, it skips straight to opening Chrome.

What the Dashboard Shows

The dashboard is organized into several sections, each pulling live data from a different source.

Solar Indices Bar
Across the very top is a live readout of current solar conditions pulled from NOAA and HamQSL: Solar Flux Index (SFI), Sunspot Number (SSN), A-Index, K-Index, X-Ray class, Solar Wind speed, Geomagnetic field status, and an overall conditions summary. The K-Index is color coded — green for quiet, yellow for unsettled, red for active — so I can see at a glance whether geomagnetic conditions are going to affect a DX session.

HamQSL Widget Bar
Three embedded HamQSL visual widgets display HF band conditions, VHF/Aurora/Es status, and a solar data summary — updated every three hours directly from hamqsl.com.

Band Conditions Panel
This panel shows current conditions for 80m through 6m, rated Good / Fair / Poor for both day and night. One detail I was careful about here: the model accounts for D-layer absorption on 80m and 40m during daylight hours. A lot of simpler tools don’t get this right — 80m is not good in the middle of the day regardless of what the solar flux says, and the dashboard reflects that correctly. Each band also shows the expected frequency range for good propagation and what conditions will look like in the opposite period.

Propagation Map
The KC2G real-time MUF map is embedded directly in the dashboard and updates automatically. A one-click button also opens the DXView EM83VK link in a new tab — this shows actual real-time propagation based on WSPRnet, Reverse Beacon Network, and DX Cluster signals, updated every minute. Between the two, I have a very complete picture of what’s actually happening on the bands right now.

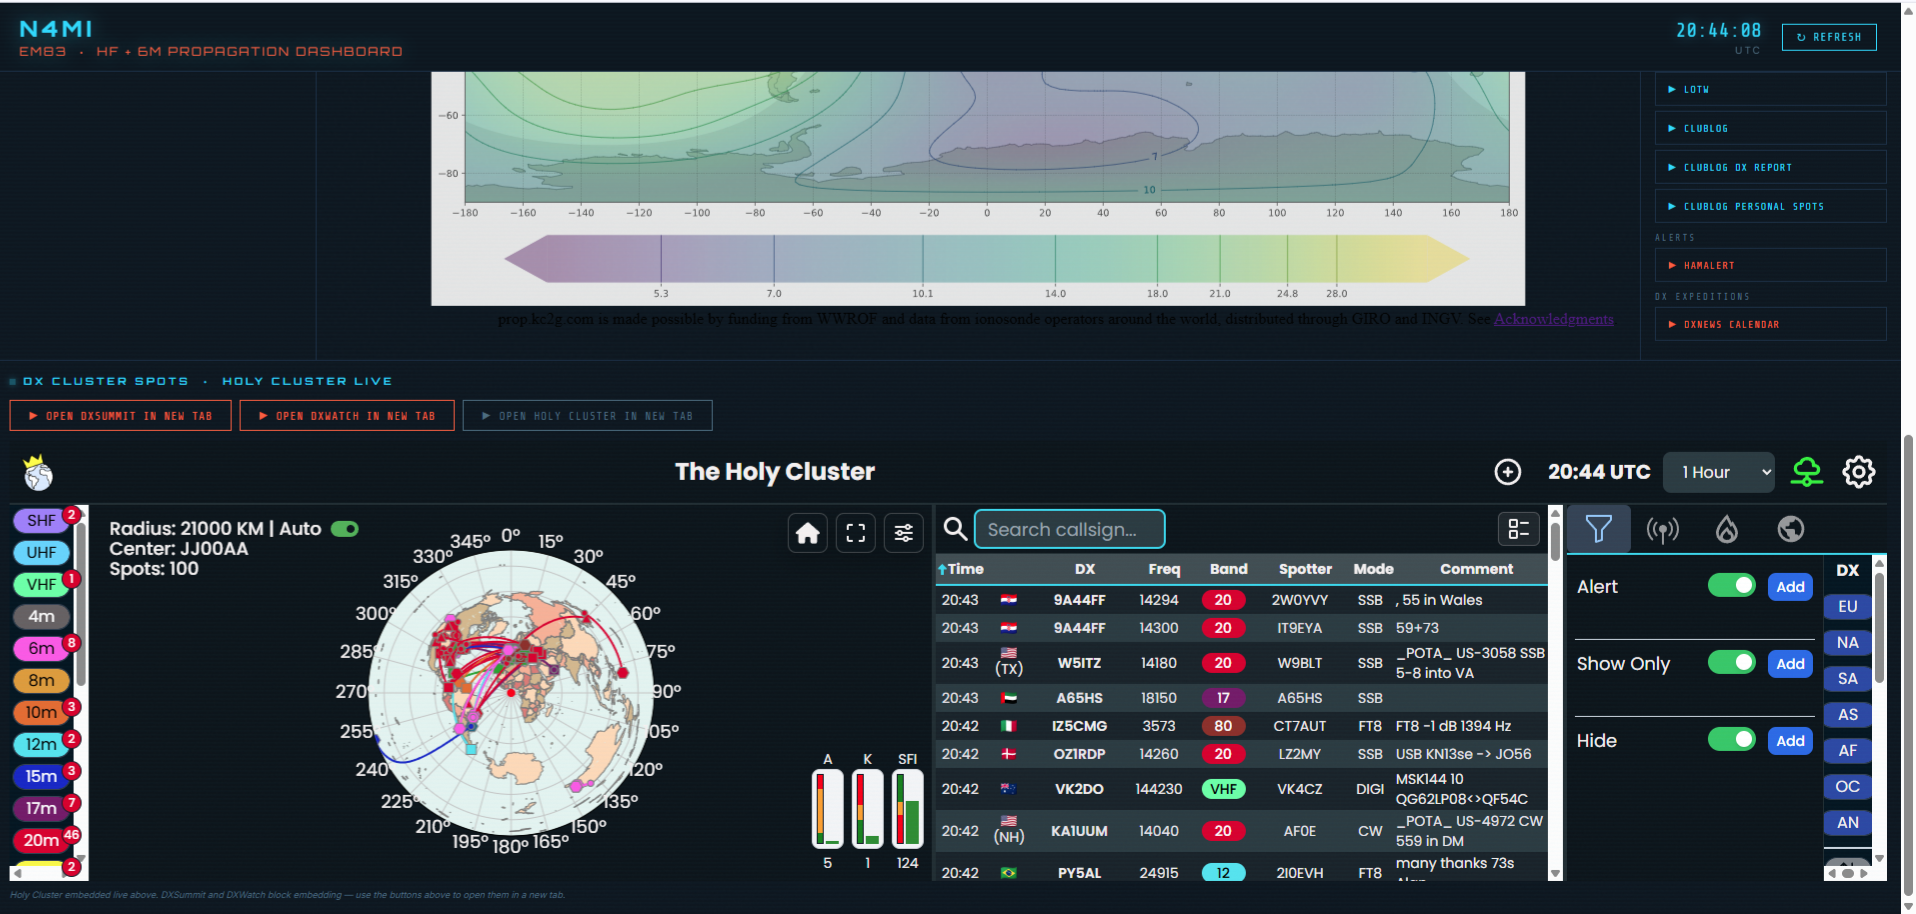
N4MI Propagation Dashboard lower half showing Holy Cluster live DX spot feed with map and spot list
The lower half of the dashboard — the Holy Cluster embedded live with a real-time spot map and filterable spot list. DXSummit and DXWatch are available as one-click new-tab buttons.

DX Cluster Spots
The Holy Cluster is embedded as a live iframe directly in the dashboard, with the full interactive map and spot list visible without leaving the page. DXSummit and DXWatch are available as one-click buttons that open in a new tab — those sites block iframe embedding due to browser security restrictions, which is a limitation of how they’re configured rather than a flaw in the dashboard.

Quick Links Panel
The right side of the dashboard has an organized set of one-click links grouped by category: Propagation, DX Cluster, Logging and Awards, DX Expeditions, and Alerts. PSKReporter is filtered directly to N4MI spots. Everything I need is one click away without hunting through bookmarks.

Storm Alert System
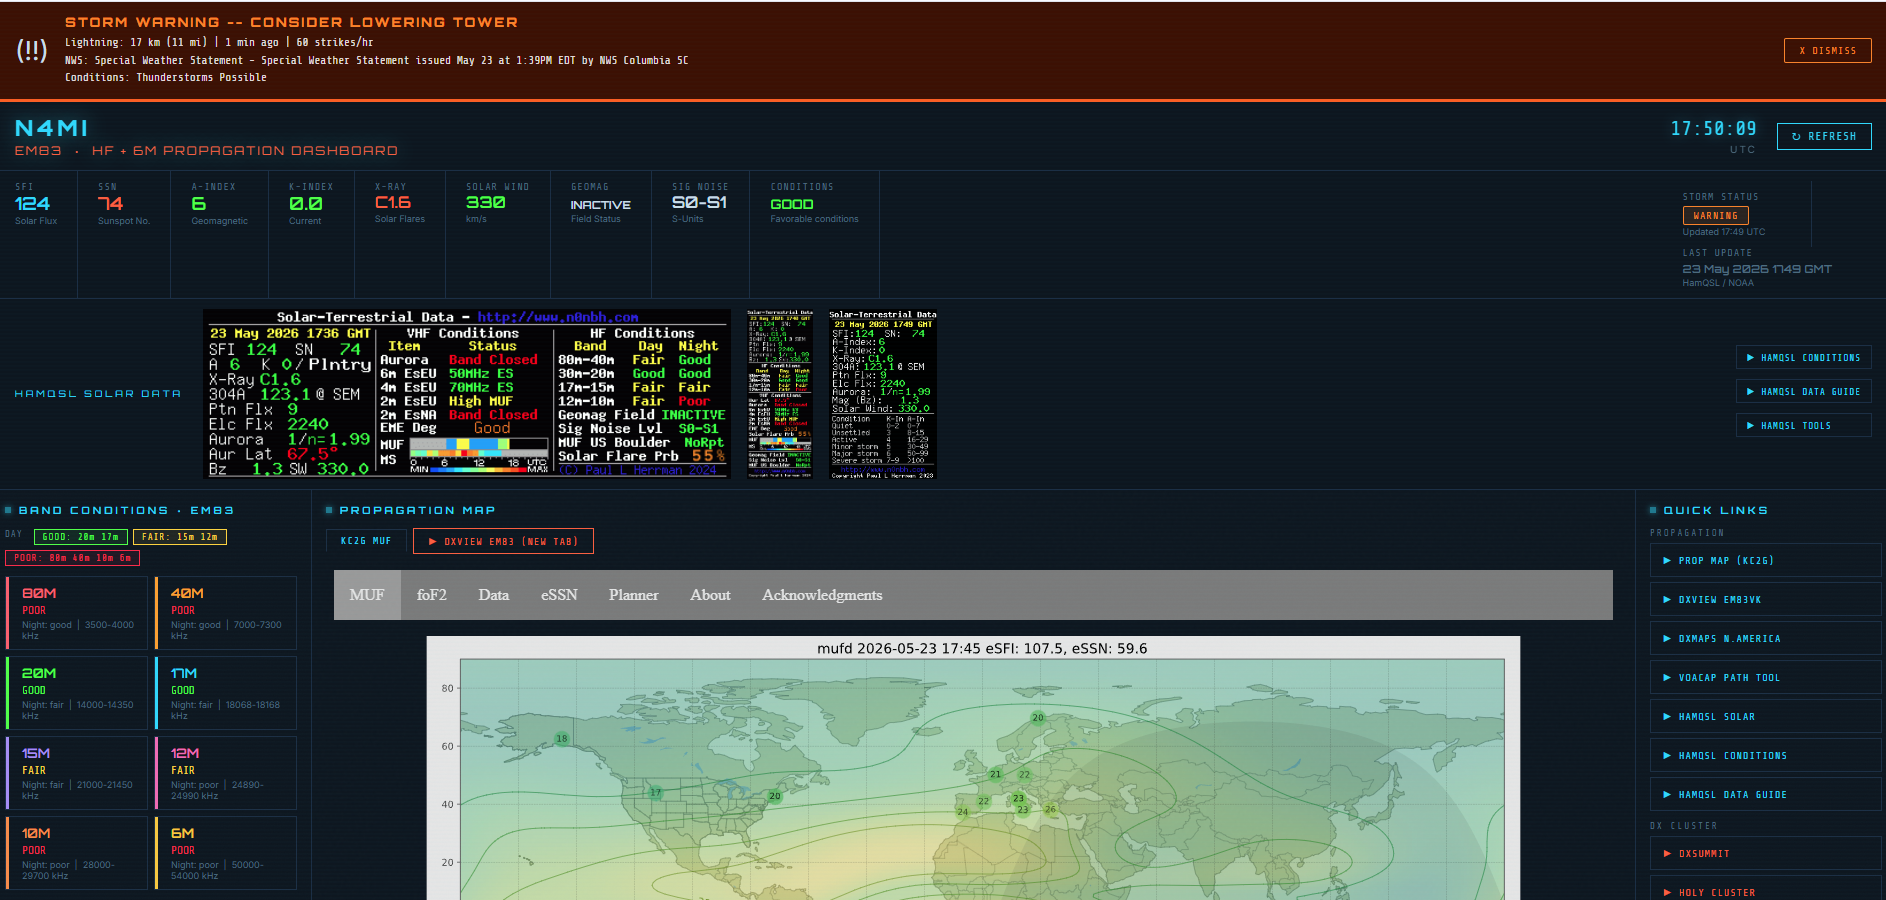
This feature came out of a real-world wake-up call. A popup thunderstorm with high winds and lightning arrived faster than expected one afternoon, and I realized I needed a proactive warning system built into my operating workflow — not a separate weather app I might not have open. The result is an integrated storm alert system that monitors two data sources simultaneously: my WeatherFlow Tempest personal weather station for hyperlocal lightning detection and wind data, and the NOAA National Weather Service alerts API for official watches and warnings affecting Columbia County.

The system uses three alert levels — Caution (yellow), Warning (orange), and Critical (red, flashing) — based on lightning distance, wind speed, and NWS alert type. When an alert is active, a full-width banner appears at the very top of the dashboard regardless of scroll position, showing lightning distance in miles, time since the last strike, strikes per hour, wind gust speed, and the full NWS alert text. The Critical level triggers on a Tornado Warning or Severe Thunderstorm Warning and displays a hard-to-ignore message: SEVERE STORM WARNING — LOWER TOWER NOW!

Even when conditions are clear, a persistent Storm Status indicator in the solar indices bar shows ALL CLEAR in green so I always know the system is active and current. During testing, the system correctly triggered a WARNING when the Tempest detected lightning 9 miles away with 356 strikes per hour — well before I would have noticed anything outside. For anyone running a tower, this kind of real-time situational awareness is worth having right in your operating portal.

N4MI Propagation Dashboard showing active Storm Warning banner with lightning distance, NWS Special Weather Statement, and WARNING status pill
The storm alert system in action — a real WARNING triggered by lightning 11 miles away with an active NWS Special Weather Statement. The orange banner stays visible regardless of scroll position, and the WARNING pill appears in the solar indices bar at top right.

How It’s Built

The dashboard runs on two files stored in C:\Ham Scripts\:

  • dashboard_server.py — a Python web server that serves the HTML file and acts as a proxy for fetching HamQSL XML data and DX cluster spots via telnet, bypassing browser CORS restrictions
  • N4MI_PropagationDashboard.html — the dashboard itself, which fetches live data from NOAA and through the local Python proxy on startup and on each manual refresh

The Python server connects to US-based telnet DX cluster nodes to fetch the latest spots, parses them by band, and serves them to the dashboard as JSON. It tries three nodes in order and falls back gracefully if one is unavailable.

Claude generated both files based on my description of what I wanted the dashboard to display. The iterative process of describing a feature, seeing the result, and refining it worked very well for something this visual — I could describe exactly what I wanted each section to look like and Claude would implement it.

Adapting It for Your Station

To use this dashboard for your own station, two things need to change:

  • Update CALLSIGN = "N4MI" in dashboard_server.py to your own callsign
  • Update the callsign and grid square references in N4MI_PropagationDashboard.html — the DXView link and band conditions model both use the EM83 grid square, so those should be updated to your own grid for accurate local propagation ratings

Both files are available for download in the project’s GitHub repository: github.com/N4MI73/streamdeck-hamradio

The next post in this series covers rotator control directly from the Stream Deck — sending azimuth commands to PSTRotatorAz via UDP with one button press, including preset headings for common DX regions from EM83.

Stream Deck for Ham Radio — Part 1: Mode Launchers & PowerShell Scripts

Why Use a Stream Deck?

The Elgato Stream Deck is best known in the gaming and streaming world, but its one-press button triggering makes it a natural fit for ham radio operating workflows. With some assistance from AI (Claude), I was able to create buttons that open all of the apps I use across my different operating modes — with a single press.

Every time I sit down to operate, I was opening the same combination of apps — logger, digital mode software, cluster, rig control. The Stream Deck eliminates that repetitive clicking and lets me focus on what matters: operating.

The real power comes from pairing the Stream Deck with PowerShell scripts on Windows, which gives far more control than simple app launching — I added sequenced delays, popup reminders, conditional logic, and even send commands directly to running software. Since I operate multiple modes (FT8, CW, SSB), switching between software stacks used to be one of the most error-prone parts of my workflow — wrong rig interface settings, apps launched in the wrong order, forgetting to reset something between modes. The Stream Deck removes that friction entirely.

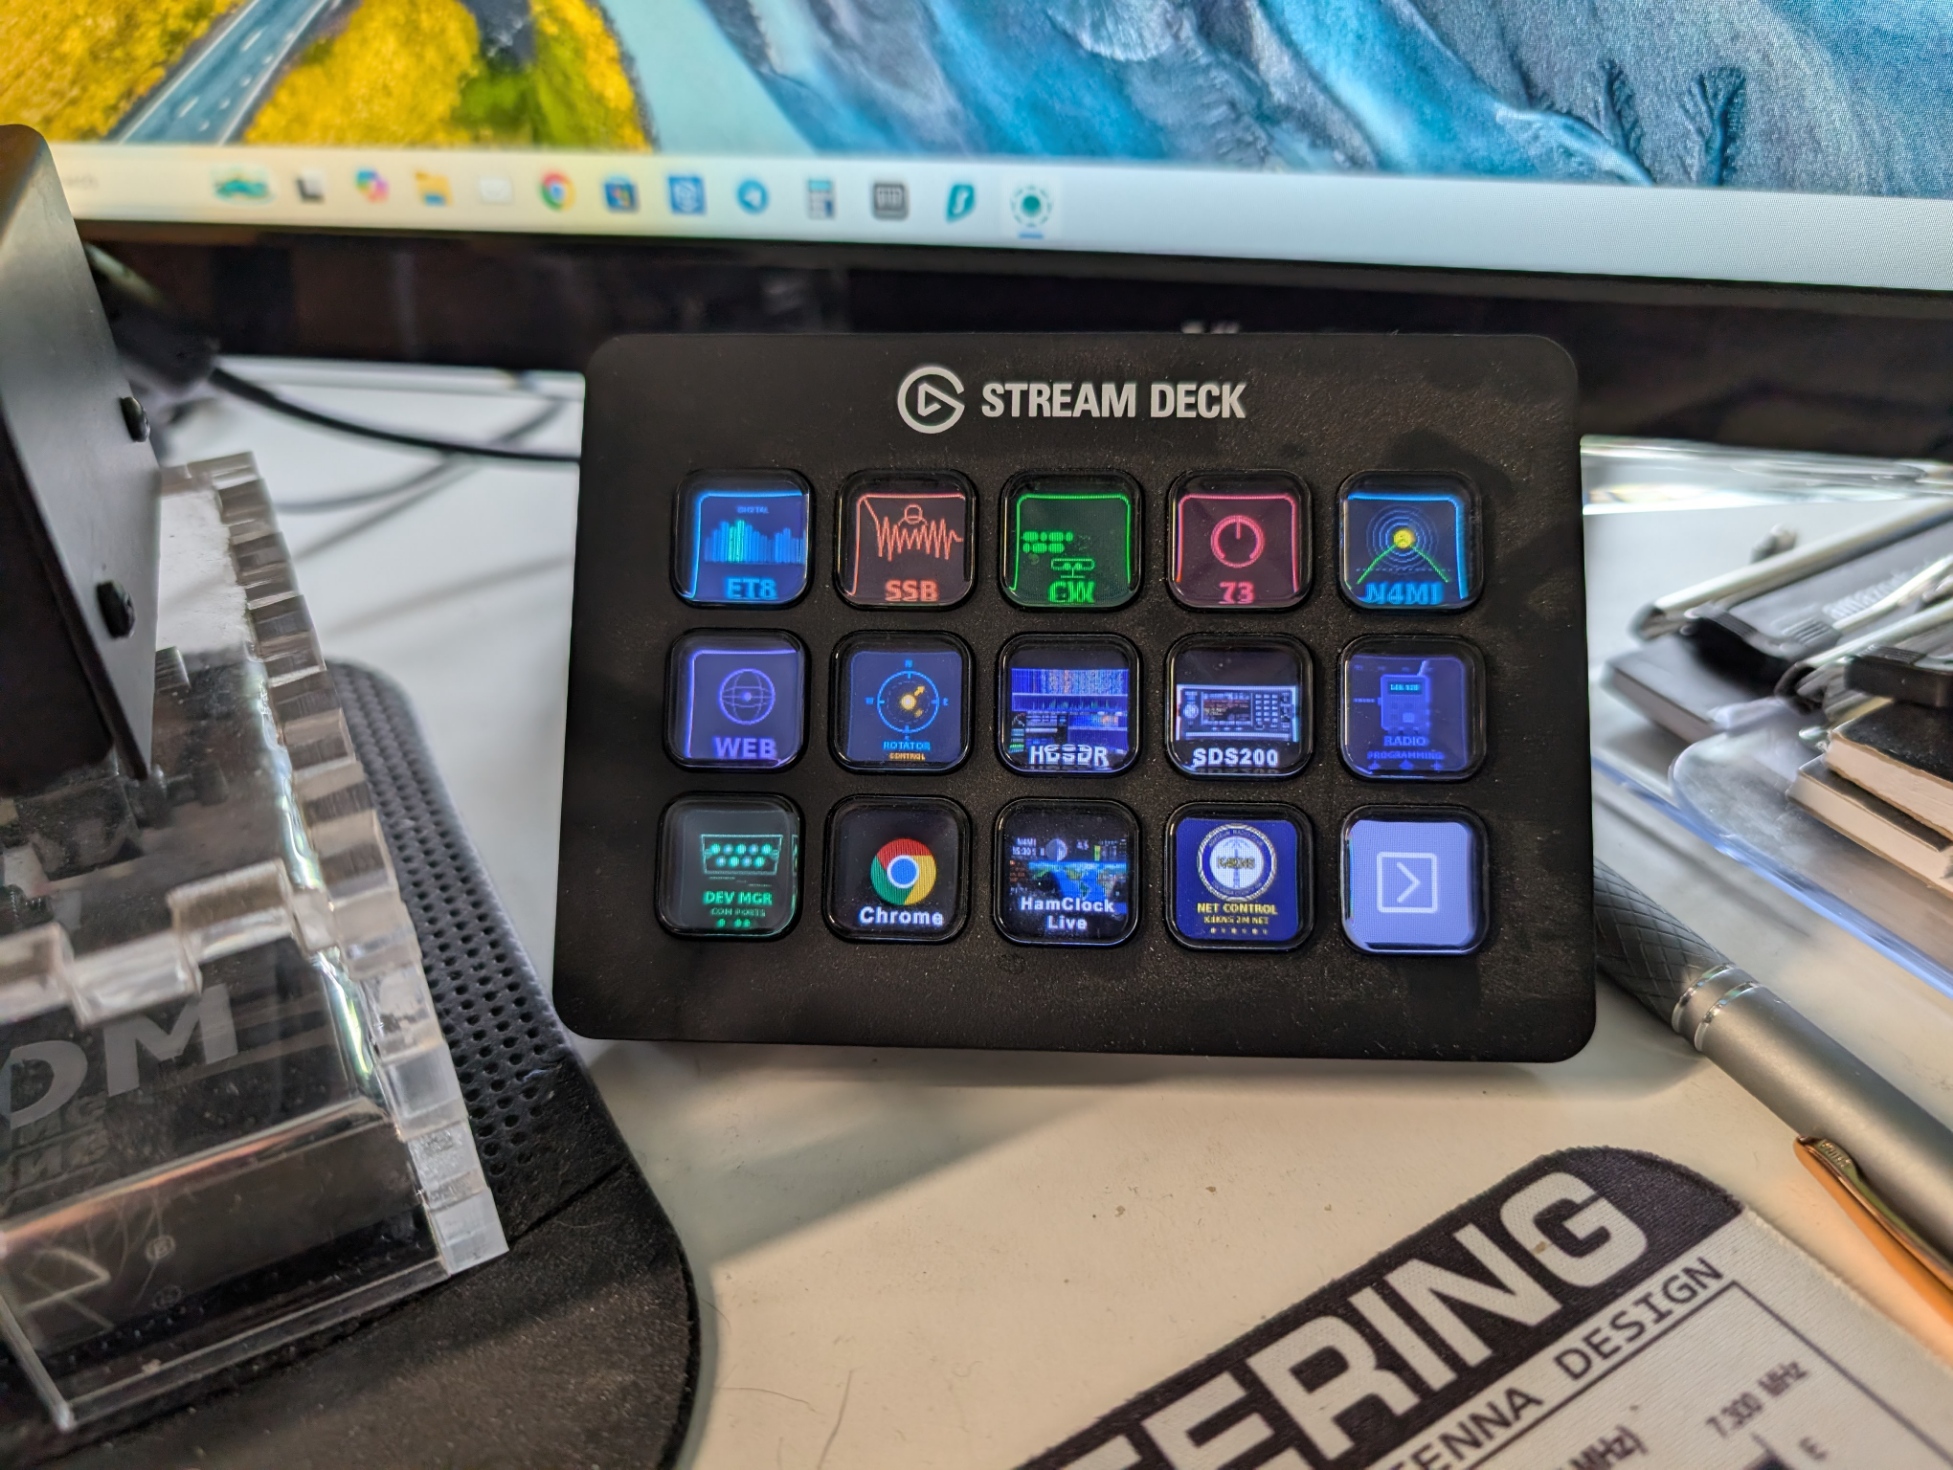
Elgato Stream Deck sitting on the operating desk at N4MI, showing custom ham radio mode buttons
The Stream Deck lives right on the operating desk — one press launches the complete software stack for any mode.

The Foundation — PowerShell Scripts

The Stream Deck’s built-in “System > Open” action can launch any application, but it lacks the ability to pass arguments or introduce delays between launches. The Advanced Launcher plugin (BarRaider) solves this by adding an Arguments field and a Run as Administrator option.

PowerShell is built into every Windows installation and is the perfect tool for writing multi-step launch sequences. Scripts are plain text files (.ps1) that anyone can read, edit, and customize in Notepad — no programming background required.

The key PowerShell concepts used in these scripts are straightforward:

  • Start-Process — launches an application
  • Start-Sleep — introduces a delay between launches
  • param() — lets one script serve multiple modes via a -mode argument
  • switch — routes execution to the right mode block
  • MessageBox — displays a popup reminder before launching
  • System.Net.Sockets.UdpClient — sends UDP commands directly to running software

Scripts are stored in a dedicated folder (C:\Ham Scripts) and called from Stream Deck buttons with the -ExecutionPolicy Bypass flag to allow unsigned local scripts to run. Claude generated all of the scripts I used, and also produced a step-by-step PDF guide for building your own from scratch.

All scripts are available for download on the project’s GitHub repository: github.com/N4MI73/streamdeck-hamradio

Custom Workflow Launchers

Different operating modes require different software combinations. Rather than memorizing which apps to open for each mode, each Stream Deck button launches the complete stack for that mode with one press.

App launch order matters. For my FT8 workflow, JTAlert depends on WSJT-X being fully loaded, and Amateur Contact Log (ACLog) needs to be ready before either. A short delay (typically 3–4 seconds) between each app gives the previous one time to initialize before the next tries to connect. For apps that require administrator privileges — like MRP40 in my CW workflow — the Advanced Launcher plugin handles elevation automatically.

Stream Deck software showing custom ham radio button layout for N4MI including FT8, SSB, CW, rotator control, and dashboard buttons
The main Stream Deck profile — FT8, SSB, and CW each launch their complete software stack with one press. The second row handles the web portal, rotator control, SDR, and logging tools.

My Three Workflows

FT8/FT4
Launch sequence: ACLog → PSTRotatorAz → WSJT-X → JTAlert

  • ACLog must be configured with Rig Interface OFF and TCP Server ON for WSJT-X to connect
  • A popup reminder appears before launch prompting me to verify the ACLog settings
  • JTAlert receives spot data from WSJT-X and requires it to be fully loaded first
  • Delay before JTAlert: 4 seconds (adjustable based on PC speed)

CW
Launch sequence: ACLog → PSTRotatorAz → MRP40

  • ACLog switches to Rig Interface ON (COM 6 for my IC-7610) and TCP Server OFF
  • MRP40 (Morse decoder) must run as Administrator — handled automatically by Advanced Launcher
  • MRP40 must be launched from its own working directory to find its supporting files — a known quirk, fixed with -WorkingDirectory in the PowerShell Start-Process call
  • The popup reminds me to verify MRP40’s COM port and sound card settings, which it doesn’t always save reliably between sessions

SSB
Launch sequence: ACLog → PSTRotatorAz

  • Simplest workflow — rig interface active, no digital mode software needed
  • Popup confirms ACLog has Rig Interface enabled before launching

ACLog Multi-Rig Tip
ACLog supports saving multiple rig configurations and switching between them instantly with Ctrl+X. Rather than manually changing settings each time, I have one profile configured for FT8 (TCP Server ON, Rig Interface OFF) and one for CW/SSB (Rig Interface ON). The popup reminder in each launcher script tells me which profile to select before clicking OK — a small thing that has saved me from a lot of head-scratching.

Clean Shutdown Script
A dedicated “Close All Apps” (73) button handles the shutdown sequence in reverse dependency order:

  • A confirmation prompt before doing anything
  • A rotator reminder to return to North (0°) before closing PSTRotatorAz
  • JTAlert closed before WSJT-X, WSJT-X before ACLog — proper dependency order
  • A prompt asking whether to stop the dashboard Python server or leave it running

On another Stream Deck screen, I still have dedicated icons to launch the programs individually, in case I have a need to open one without the others.

Future posts in this series will cover a tailored propagation and information portal for my location and callsign, and controlling my rotator directly from the Stream Deck.

📁 Downloads: All scripts, the propagation dashboard, and the complete icon set are available at the project repository: github.com/N4MI73/streamdeck-hamradio

Possibly My Last DXCC Endorsement (But I Sure Hope Not)

This week I finally achieved a DXCC milestone I have been chasing for several years. I finally got 275 countries confirmed in LoTW. When I reached 25o a few years ago, I figured that I would not go much higher. The station upgrades are paying off. I have been mostly focused on making SSB and CW contacts, but will certainly still work FT8 for ATNOs and band-slot fillers!

As all DXCC award chasers know, once you reach 200 the ATNOs become more difficult and less frequent. This makes each one more exciting and meaningful. With the current solar cycle on the decline, I don’t know whether I will reach 300 or higher, but I will certainly keep trying!

LoTW DXCC Credit Analyzer Updated

I have continued to work on this app. This was a labor of love, really, to help me in my pursuit of ATNOs and band/slots for DXCC awards and endorsements. I have shared it in several venues hoping that other hams with similar pursuits would find it helpful. I have also received some excellent feedback to add features and improvements.

LoTW DXCC Credit Analyzer

I Vibe-Coded a Web App!

LoTW DXCC Credit Analyzer

I’ve been reading a lot about vibe-coding, and thought I would give it a try. I have been off-and-on trying to learn Python. Maybe someday I will get it.

I have always wanted an app that would perform analysis of the DXCC Award Credit Matrix from Logbook of the World. There is no option to download the table as a spreadsheet. So, I thought I would try to cook something up myself using AI coding.

I used Lovable, which is an AI-powered, no-code app builder designed to create web applications and websites from simple text prompts. It enables users to rapidly build functional, production-ready apps—such as project management tools, calculators, or landing pages—by generating code and UI through conversational AI.

I create a web app called “LoTW DXCC Credit Analyzer” for DXCC entity, band-slot and mode analysis. The analysis does not include deleted entities. Also, I could not completely automate the process because of the way LoTW displays the DXCC Award Credit Table (no option to download the table as a spreadsheet or CSV file). I included instructions in the app for creating a spreadsheet from LoTW’s DXCC Award Credit Table, which can then be loaded into the app. Feel free to give it a try!

Finally Got 150 Confirmed on Phone

I have been working a lot more SSB since I added the hexbeam and amplifier to the station. The majority of my confirmed DXCCs has been on digital modes FT8, and before that JT65), so I have been making more of an effort to confirm DXCCs on CW and phone. DXpeditions over the past few months have helped tremendously. I have reached 273 DXCCs on LoTW, so the going will be very tough from here. Hopefully I can continue to add to the CW and phone totals!

Signed up for World Radio League

My preferred logging software is N3FJP’s Amateur Contact Log. It is easy to use, and integrates well with my IC-7610, and with WSJT-x/JTAlert. It can also automatically upload contacts to several online logging/QSL platforms (LoTW, QRZ, CLubLog, and eQSL). I have been very happy with this workflow, and it covers my logging and verification needs.

At the recommendation of a trusted friend, I decided to check out World Radio League (WRL). It is a cloud-based application that is sort of a mashup of a logbook and social networking for ham radio operators. The team that designed and built the application also created Ham Radio Prep, which is a web-based application that prepares hams for license exams.

WRL is available as a web application, as well as apps for Android and Apple phones and tablets. You can sign up for WRL for free, with limited features. There are also three paid levels (Basic, Premium, and VIP) that offer more features and capabilities. I chose the Premium level for $60/year.

I have only started to explore the options in the WRL web application. I was able to create a profile with my station information, and uploaded an ADIF file (from ACLog) with all of my contacts. Those two processes went smoothly.

Here are a few screenshots showing some of the key pages and features in the WRL web app:

This is the home screen that is displayed after logging in to WRL.
This is the logbook page in the web app.
The logbook page includes a map depicting the logged contacts.
The Analytics page displays all of the countries and states I have worked. It appears that the confirmations only include those from within WRL.
The Activities page shows a map or list of POTA, SOTA, IOTA, and WWF sites.
The Spotting page includes a very customizable map and list of live spots.
The Contests page is very interesting. The app can create logbooks for various contests. The page shows current and upcoming contests, and allows you to “enroll” to create a logbook for the contest.
The Integrations page is for setting up and configuring integration with QRZ.com and LoTW sites, WSJT-X, N1MM, and N3FJP.
The Find Members Near Me page shows locations (not exact) of other WRL members.

Each of the pages on the web app have a multitude of configurations and display options. There are also several other functions that I haven’t explored yet. I also need to check out the app on my tablet and phone. Time will tell whether WRL will replace any of the other applications in my workflow, or supplement them. I’ll post an update after digging deeper into WRL.